I built a dashboard to calculate when you can retire
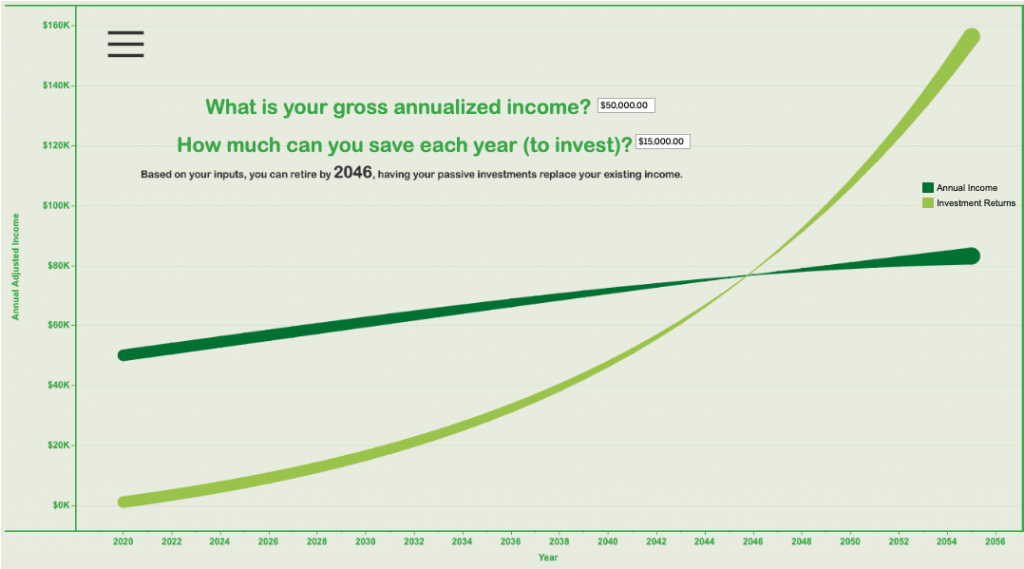
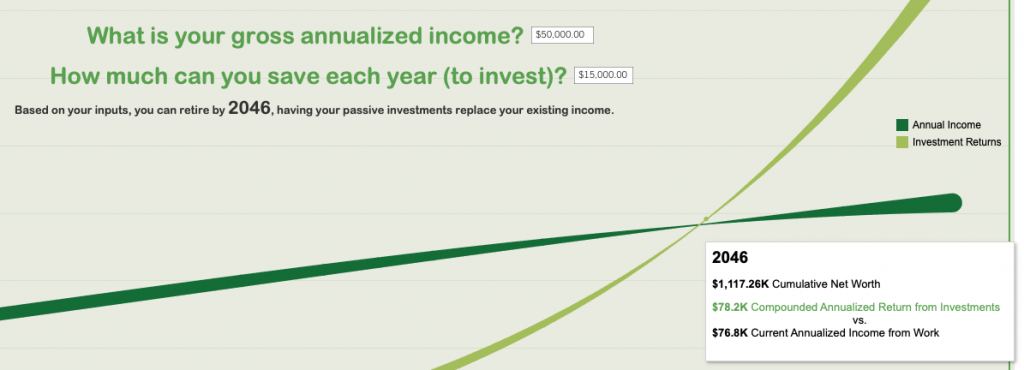
Using the awesome Tableau application once again, I was able to create an interactive visualization depicting the point in time an individual can expect to effectively converge or replace their active income with their passive investment income (generated from compounded earnings and investments).
One of the things I’m particularly proud of, is that this dashboard uses no data sources whatsoever. Everything is self contained in the workbook, which is simply an increasing sequence of “years” from 2020 upwards, and several calculated fields.
My goal was to keep this the best of all worlds between: simple, interactive and informative.
Users of this dashboards likely have varying levels of income and varying spending habits, so at the very least this dashboard should require 2 inputs: Gross Income and Annual Savings, to better personalize results.
The output in terms of the visualization should be, in its simplest form, 2 lines that intersect: Gross Annual Income and Change in Net Worth(synonymous to earnings from passive income/growth). What makes this challenging is that in a perfect world, neither the gross annual income – nor the passive income that is compounding will be stagnant throughout time. Both tend to trend upwards due to income raises and accumulated investments, respectively, over time. In short, the following is how the two output lines were generated.
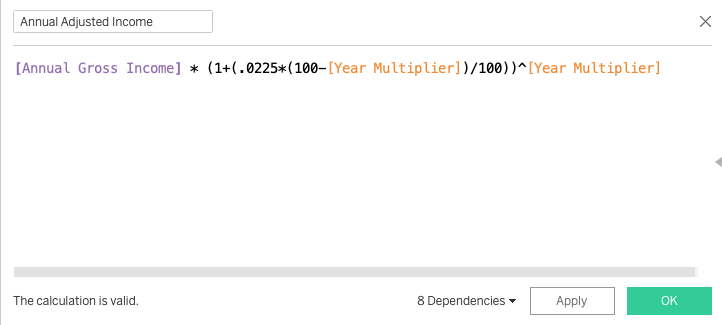
Annual Adjusted Income
This is the income generated from work. It will take the input, Annual Gross Income, and apply a raise of 2.25% compounded annually. There is also a somewhat arbitrary inverse of “Year Multiplier” I factored in, intended to reduce or taper-off that 2.25% raise over time as income from wages tends to slope downward late in careers (i.e. finding a new job as you approach retirement years).
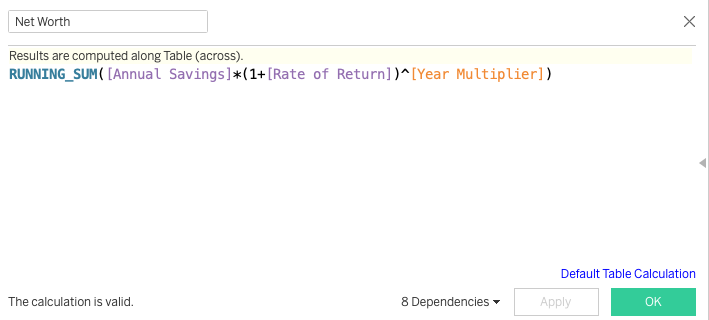
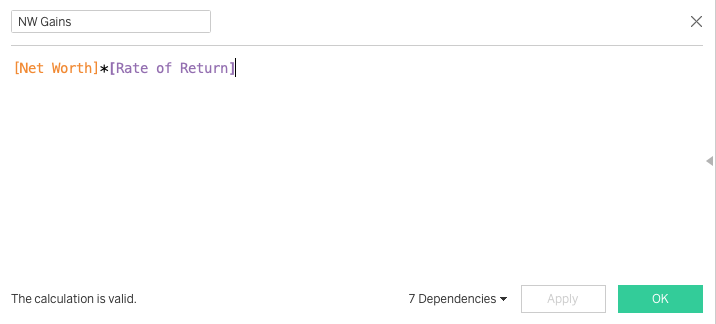
Net worth Gains
Before we get to Net worth Gains, we have to define what our Net Worth is. This will be a running sum of our Annual Savings (the input provided by the user), multiplied by the Rate of Return of investments (defaulted to 7%).
For our Networth Gains calculation, this will be our principal starting balance of Net Worth of the current year, multiplied by the Rate of Return of investments. In our case, we defaulted the Rate of Return to 7%.
With that being said, our “NW Gains” and “Annual Adjusted Income” as dual-axis measures, in aggregation, across number of years, as dimensions, enable us to achieve a converging visualization depicting the year in which our investment returns will begin to exceed our earned income.
Hope you enjoyed this small write-up as much as I did building it!